 NeoBit Daily
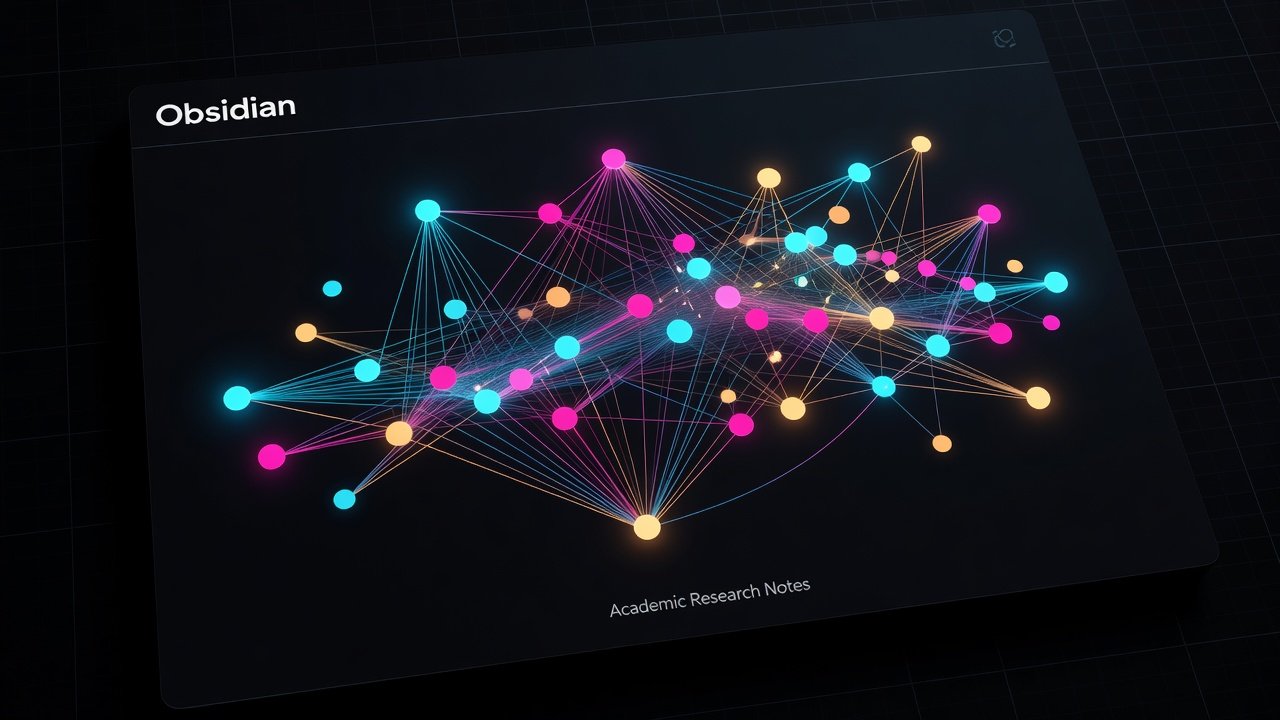
Introduction to Advanced Graph View in Obsidian 2026
Obsidian has become an essential tool for researchers seeking to synthesize complex knowledge networks. In 2026, its Graph View offers sophisticated visualization capabilities that go far beyond basic note linking. This guide explores advanced techniques tailored for academic and research workflows, helping users transform sprawling vaults into insightful visual maps that reveal hidden patterns in literature, data, and ideas.
Researchers benefit from seeing connections between ideas, citations, and data points that might otherwise remain hidden in linear text. By mastering filters, plugins, and optimizations, you can accelerate literature reviews, hypothesis generation, and collaborative projects. The graph becomes a living representation of your research, evolving as you add notes and links. Whether you are managing a PhD thesis vault or a multi-team scientific project, these techniques provide clarity and speed in knowledge synthesis.
Customizing Graph Filters for Precision Analysis
Effective graph analysis starts with precise filtering. Obsidian's native controls allow users to exclude tags, folders, or note types that clutter visualizations. For example, filter out daily notes while highlighting literature references to focus on core research themes. Users can combine multiple filters such as note type, link direction, and metadata fields to isolate specific clusters.
Advanced users leverage query-based filters to isolate specific connection strengths or date ranges. This is particularly useful in large vaults containing thousands of notes from multi-year studies. Consider creating saved filter presets for recurring tasks like reviewing experimental results versus theoretical frameworks. Practical steps include opening the graph, accessing the filter panel, and testing combinations iteratively until the view highlights meaningful relationships without overwhelming detail.
- Exclude folders like "Daily Notes" or "Templates" to reduce noise.
- Use tag filters such as #literature or #hypothesis to emphasize academic content.
- Apply date-based filters to focus on recent additions from the past month.
Leveraging Plugins: Juggl and Advanced Graph
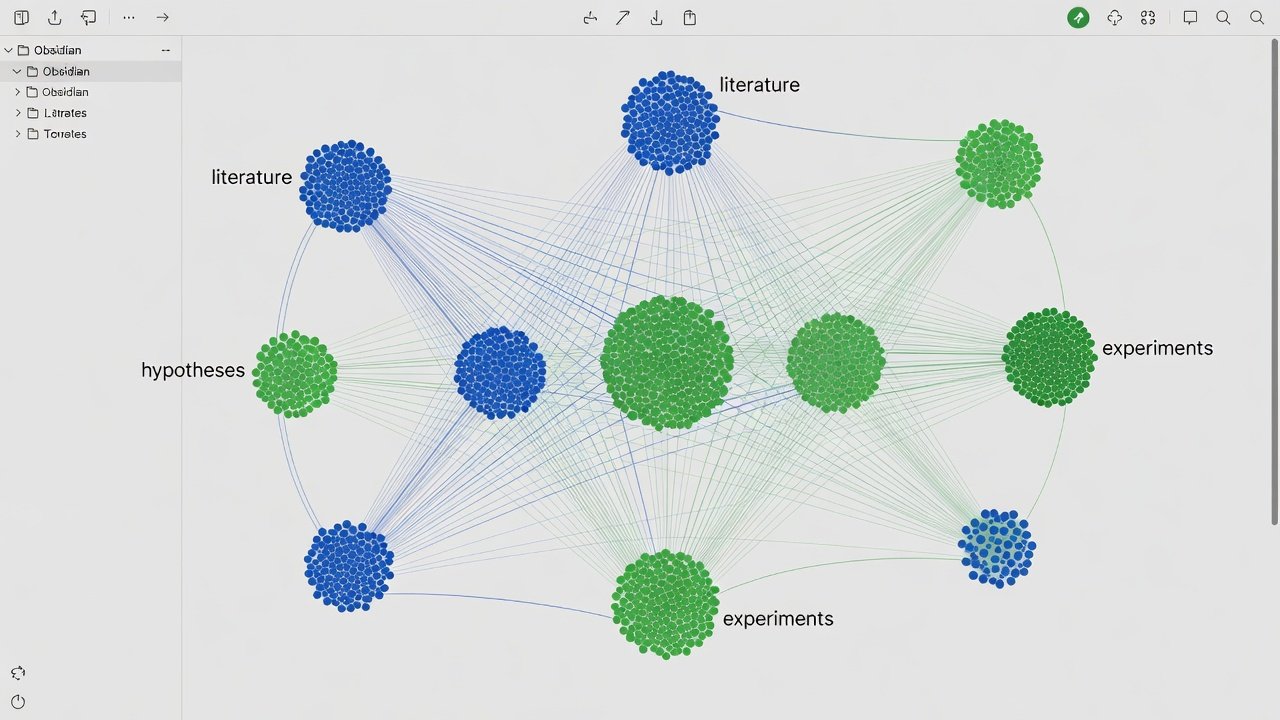
Community plugins extend Graph View functionality significantly. Juggl enables dynamic, interactive graphs with physics-based layouts, ideal for exploring emergent patterns in interconnected research topics. Advanced Graph adds features like node grouping by metadata and custom edge styling based on link types, allowing researchers to differentiate between citation links and conceptual associations.
Step-by-step setup for Juggl begins with installing the plugin through Obsidian's community plugins browser. Enable it in settings, then configure layout algorithms such as force-directed graphs to emphasize clusters relevant to your field, like grouping by research methodology or geographic study locations. For Advanced Graph, follow similar installation, then define metadata schemas in your templates to automatically color-code nodes representing experiments versus theoretical notes. These plugins integrate smoothly with existing vaults and support real-time updates as you edit notes.
Visit the Obsidian official site for plugin documentation and compatibility details.
Building Visual Maps from Complex Note Networks
Start by establishing consistent linking practices using aliases and block references. Then apply graph layouts that reveal hierarchies or thematic clusters. Real-world academic example: A historian mapping primary sources might create nodes for events, people, and documents, using edge weights to represent citation frequency. This reveals influence pathways across centuries and helps identify overlooked connections in archival material.
Another example involves a biologist constructing a map of gene interactions drawn from multiple papers. By linking notes on experiments with notes on theoretical models, the graph highlights potential research gaps. To build such maps, begin with a core set of 50 notes, add bidirectional links, and refine the layout over several sessions. This iterative process ensures the visualization remains accurate and actionable.
Performance Optimization for Large Vaults
Large research vaults can slow Graph View rendering when file counts exceed several thousand. Mitigate this by indexing only active folders, disabling unnecessary plugins during analysis, and using snapshot exports for static views. Additional strategies include breaking vaults into linked sub-vaults for different projects and running periodic maintenance to remove broken links. Regular vault maintenance, such as pruning orphaned notes, ensures smooth performance even with extensive file collections.
Integration with Daily Notes and Templates
Seamlessly connect Graph View to daily notes by templating links to ongoing projects. Use the core templates plugin to auto-insert graph-relevant metadata like keywords or status tags. This integration supports iterative knowledge building, where daily reflections feed into broader visual syntheses. For instance, a researcher can template each daily note with a section for new links to key literature nodes, automatically updating the graph each evening.
Comparisons of Visualization Tools
While Obsidian excels in local, markdown-based control, alternatives like Roam Research offer similar graphs but with different collaboration models. For pure visualization, tools such as Cytoscape provide advanced analytics but lack Obsidian's seamless note editing. Choose based on whether your priority is integrated writing or standalone network analysis. Obsidian stands out for its offline-first approach and extensibility through plugins.
Common Mistakes to Avoid
Many users overload graphs with every note, leading to unreadable clusters. Instead, apply progressive disclosure by starting narrow and expanding. Another pitfall is inconsistent linking, which fragments the network. Establish conventions early, such as always using specific link types for citations.
Export Options and Sharing Research Graphs
Export graphs as images or interactive files for presentations and publications. Plugins support SVG exports suitable for high-resolution figures in academic papers. Sharing options include embedding graphs in shared vaults or exporting to web formats for collaborators. Explore these features to disseminate findings effectively.
Conclusion
Mastering these techniques positions researchers to leverage Obsidian as a true knowledge engine in 2026. Experiment with the outlined steps to unlock deeper insights from your note networks and enhance productivity across projects.
FAQ on Common Graph Pitfalls and Export Options
- How do I avoid graph overload? Start with strict filters and gradually expand visible elements as patterns emerge.
- What export formats are supported? Use native image exports or plugins for SVG and interactive HTML outputs suitable for reports.
- Can graphs sync across devices? Yes, via Obsidian Sync or third-party vaults, though large graphs may require selective loading on mobile.
- Are there limits to node customization? Plugins like Juggl allow extensive styling, but test performance on your hardware first.
No comments yet. Be the first!