 NeoBit Daily

Introduction to Explainable AI in 2026
As machine learning adoption accelerates across sectors, professionals increasingly demand transparency in model decisions. This 2026 practical guide focuses on AI tools that enable explainable ML systems, addressing search intent for actionable implementation rather than theory. Readers will discover step-by-step frameworks for bias detection, feature importance visualization, and regulatory adherence. Explainability ensures stakeholders understand why models produce specific outputs, reducing risks in high-stakes environments. Recent advancements have introduced integrated libraries that combine deep learning with post-hoc explanation methods, making it easier for teams to move beyond black-box approaches.
The demand for interpretable models stems from both ethical considerations and practical business needs. Organizations that prioritize transparency often see improved stakeholder trust and smoother deployment cycles. This guide emphasizes hands-on techniques that professionals can apply immediately to their existing workflows.
Why Transparency Matters Now
Regulatory bodies emphasize accountability, pushing organizations toward interpretable systems. In finance, unexplained credit decisions can trigger audits, while healthcare models require justification for patient outcomes. Tools now support real-time explanations, allowing teams to monitor drift and fairness continuously. Without transparency, models risk perpetuating hidden biases that could lead to legal challenges or loss of user confidence. For instance, in lending scenarios, regulators increasingly require documentation showing how input variables influence approval rates across different demographic segments.
Transparency also drives better model performance over time. When teams can visualize and interrogate feature contributions, they identify data quality issues early and refine models proactively. This proactive stance reduces costly retraining cycles and supports ethical AI development practices that align with broader industry standards.
Comparing Leading AI Tools for Explainability
Several platforms stand out for their balance of usability and depth. SHAP and LIME remain foundational for local and global explanations. Newer entrants integrate automated dashboards that visualize feature contributions without extensive coding. When evaluating options, consider factors such as compatibility with your primary modeling framework, scalability for large datasets, and the level of customization available for custom visualizations.
- SHAP offers consistent additive explanations across tree-based and neural models, providing both global and local insights that help teams understand overall feature impact as well as individual prediction drivers.
- LIME excels at approximating black-box behavior with interpretable surrogates, making it particularly useful for quick sanity checks on complex neural networks where full retraining is impractical.
- Microsoft's InterpretML provides unified APIs for multiple explanation techniques, allowing seamless switching between methods depending on the stage of the project lifecycle.
- Google's What-If Tool enables interactive exploration of counterfactuals, empowering non-technical stakeholders to test hypothetical scenarios directly through an intuitive interface.
Teams should evaluate based on model type, data volume, and integration needs with existing pipelines. Open-source options often pair well with cloud-based monitoring services for hybrid environments.
Step-by-Step Setup of an Explainability Framework
Follow this process to embed transparency into your ML workflow. Begin by auditing your current data pipeline to ensure all relevant metadata is captured for later explanation generation. Next, select a base model such as XGBoost or a neural network and train it on your dataset using reproducible random seeds. Install core libraries including shap and lime via pip, then configure environment variables to log explanation outputs automatically.
- Select a base model such as XGBoost or a neural network and train it on your dataset.
- Install core libraries including shap and lime via pip and verify version compatibility.
- Generate global feature importance plots to identify dominant variables and potential redundancies.
- Apply local explanations on individual predictions to validate logic against domain expertise.
- Integrate bias detection modules to flag disparate impact across demographic groups using fairness metrics.
- Deploy a monitoring dashboard that refreshes explanations on new data batches and alerts on significant shifts.
- Document all configuration choices in a shared repository for team collaboration and future audits.
This setup typically completes within a few hours for mid-sized projects and scales to production environments with minimal additional overhead when automated pipelines are in place.
Bias Detection and Feature Importance Visualization
Bias detection begins with fairness metrics such as demographic parity and equalized odds. Visualization libraries render heatmaps and dependence plots that highlight problematic correlations between protected attributes and model outputs. Practitioners can layer these visualizations with statistical tests to quantify the severity of detected biases before mitigation strategies are applied.
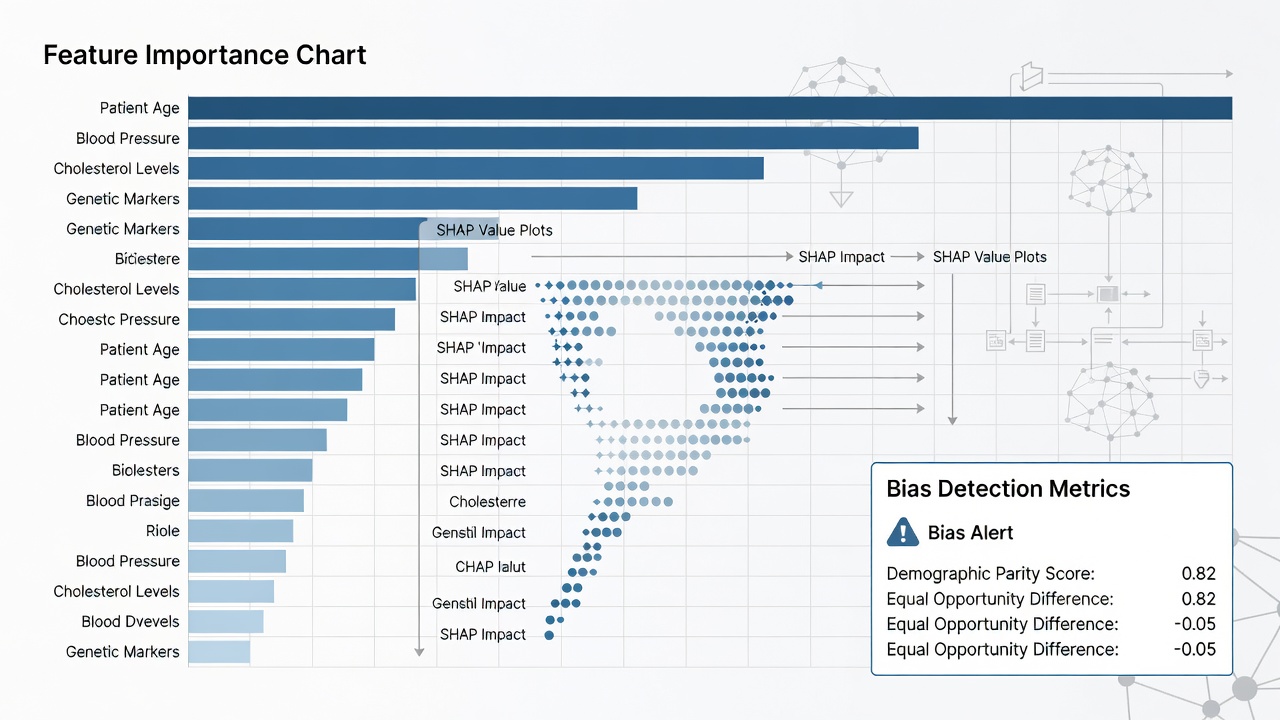
Feature importance techniques rank variables by contribution, helping practitioners prune irrelevant inputs that may introduce noise or bias. Regular audits using these visualizations maintain model integrity over time. In practice, combining multiple visualization types—such as summary plots alongside waterfall charts—provides a more complete picture of model behavior across different data slices.
Real-World Examples from Finance and Healthcare
In banking, credit scoring models now incorporate SHAP values to explain loan approvals to regulators and customers alike. This approach has improved trust scores and reduced complaint volumes by providing clear, individualized rationales for decisions. Healthcare providers apply similar methods to diagnostic imaging models, surfacing which pixels influence malignancy predictions. Such transparency supports clinician oversight and aligns with standards from FDA guidelines.
Additional sectors like insurance use these tools to justify premium calculations, while manufacturing applies them to predictive maintenance models to demonstrate safety compliance. Each example underscores the value of tailoring explanation depth to the audience, whether technical teams or external auditors.
Regulatory Compliance Strategies
Compliance frameworks like the EU AI Act require documented explanations for high-risk applications. Tools that export audit-ready reports simplify adherence. Organizations should maintain versioned explanation logs and conduct periodic third-party reviews. Reference materials from NIST AI Risk Management Framework provide structured checklists for implementation. Additional guidance is available through ISO standards on AI, which outline risk assessment procedures that complement technical explainability efforts.
Building internal review boards that include both data scientists and legal experts further strengthens compliance posture and ensures explanations meet both technical accuracy and regulatory clarity requirements.
Integrating AI News Updates into ML Projects
Stay current by subscribing to official release channels from major libraries. Schedule quarterly reviews to evaluate new explanation methods against your use cases. Pilot emerging features on non-critical datasets before full rollout to avoid disruption. Incorporate community forums and academic preprints into your knowledge base to anticipate shifts in best practices. This ongoing integration prevents technical debt and keeps models aligned with the latest advancements in interpretability research.
Common Mistakes to Avoid
One frequent error is over-relying on a single explanation method without cross-validation. Another is neglecting to update explanations after model retraining, which can lead to stale insights. Teams should also avoid presenting overly technical visualizations to non-expert stakeholders without accompanying plain-language summaries.
Frequently Asked Questions
How do I choose between SHAP and LIME?
SHAP provides more theoretically grounded values, while LIME offers faster approximations for very large models. Test both on a sample to determine fit for your specific constraints.
What industries benefit most from explainable ML?
Finance, healthcare, and insurance lead adoption due to regulatory scrutiny, though retail and manufacturing also gain from improved decision transparency and operational efficiency.
How often should explanations be refreshed?
Refresh explanations whenever models retrain or when data distributions shift noticeably, typically monthly in production settings to maintain relevance.
Can explainability tools handle real-time inference at scale?
Yes, many modern implementations support streaming explanations through optimized libraries, though careful resource allocation is required for high-throughput environments.
Conclusion
Implementing explainable ML tools in 2026 empowers professionals to build trustworthy systems. By following structured setups, leveraging visualization techniques, and aligning with compliance requirements, teams can deliver models that perform reliably while remaining interpretable. Continuous learning and integration of updates ensure long-term success and position organizations to adapt quickly to evolving standards.


No comments yet. Be the first!