 NeoBit Daily

Introduction
IT teams frequently view operating system updates as routine security tasks, yet the 2026 patch notes from major vendors contain a wealth of untapped information about performance enhancements. These notes often detail improvements in boot times, reduced resource consumption, and better application responsiveness that go far beyond basic vulnerability fixes. This comprehensive guide equips IT professionals with step-by-step methods to scan and interpret release notes across Windows, macOS, and Linux, enabling teams to identify and validate meaningful performance wins before rolling out updates broadly.
By adopting structured analysis frameworks, organizations can transform update cycles into opportunities for measurable efficiency gains. Readers will learn how to establish baselines, select appropriate benchmarking tools, and apply practical checklists that ensure consistent results. The focus remains on actionable techniques rather than superficial summaries, helping teams stay engaged with concrete examples and decision frameworks throughout.
Why Performance Signals Hide in Patch Notes
Software vendors prioritize security highlights in public announcements, but detailed changelog entries frequently reference kernel-level optimizations, memory management tweaks, and driver refinements. These changes directly influence metrics such as startup duration and idle power draw. Understanding the terminology used in each vendor’s format allows teams to translate technical notes into business-relevant outcomes like reduced hardware refresh cycles or improved user productivity.
Many performance improvements appear in minor sub-bullets or commit descriptions rather than bold headlines. Developing a habit of cross-referencing multiple sources, including internal testing data, prevents missed opportunities that could compound across large fleets of devices.
Step-by-Step Method for Windows Patch Notes
Start by accessing the official Microsoft documentation and locating the specific cumulative update notes for the 2026 release cycle. Use targeted keyword searches for terms including “boot,” “memory footprint,” “DWM composition,” and “storage I/O.” Each relevant entry should be logged with its associated KB number and build identifier for traceability.
Next, examine the Windows Update history to confirm deployment sequencing and any prerequisite patches. This step reveals whether a performance claim depends on earlier updates. Document any mentions of scheduler adjustments or power-management enhancements that could affect laptop fleets differently from desktops.
Expanded Practical Checklist for Windows
- Establish a baseline by capturing cold-boot timing using the built-in boot performance tracing tools on a representative hardware sample.
- Measure average RAM utilization during idle periods after login, repeating the measurement across three separate sessions to account for variability.
- Execute a standardized workload test that includes launching common productivity applications and recording launch durations; average results over multiple runs.
- Compare post-update values within a 48-hour window, noting any background services that might skew readings.
- Validate findings on both managed and unmanaged devices to understand policy impacts.
Analyzing macOS Release Notes
Apple’s support documentation provides concise yet data-rich notes for each 2026 macOS update. Search specifically for references to Metal framework improvements, unified memory allocation changes, and App Nap enhancements. These entries often include quantified graphics or battery-life benefits that translate directly to mobile workforce scenarios.
Cross-check the notes against the macOS version history to identify whether a change applies only to specific silicon generations. This distinction matters for mixed-hardware environments where older Intel-based Macs may not receive the full benefit.
Linux Kernel and Distribution Patch Formats
The Linux kernel changelog offers granular commit-level detail on scheduler, page-cache, and filesystem optimizations. IT teams should review both upstream kernel notes and distribution-specific backports from sources such as Ubuntu or Fedora release announcements. Focus on entries describing reduced context-switch overhead or improved NUMA handling for server workloads.
Because Linux distributions vary in their packaging of patches, maintain a comparison matrix that aligns kernel version numbers with distribution release notes to avoid duplication of effort across different environments.
Benchmarking Tools and Before/After Testing
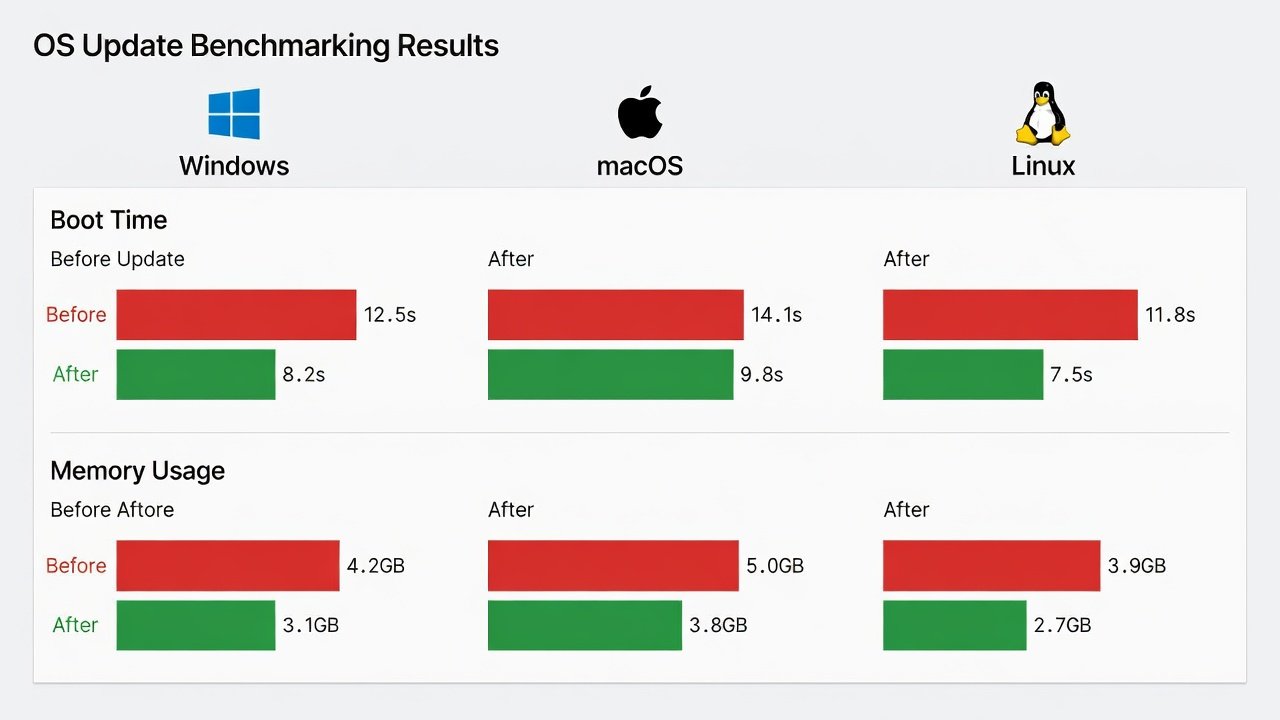
Selecting the right tools ensures reproducible measurements. Windows environments benefit from the Windows Performance Toolkit and built-in Resource Monitor. macOS users can leverage Instruments for detailed profiling, while Linux teams often rely on perf, iostat, and the Phoronix Test Suite for cross-distribution comparisons. Run tests on isolated hardware with consistent workloads, then record deltas in a centralized log that includes build numbers and test dates.
Comparison of Performance Signals Across OS Patch Formats
Windows patch notes tend to be lengthy and distributed across multiple documents, requiring systematic keyword filtering. macOS notes are shorter but frequently include percentage improvements that simplify quick assessments. Linux notes demand familiarity with kernel terminology yet provide the most granular technical insight. Creating an internal translation table that maps each format’s language to standardized metrics—such as seconds for boot time or megabytes for memory—streamlines analysis across heterogeneous fleets.
Real-World Examples from Recent 2026 Updates
One mid-sized enterprise identified a listed reduction in Explorer memory usage within a Windows cumulative update. After controlled testing on pilot machines, the team deployed the patch to 2,500 endpoints and observed average login times decrease by double-digit percentages within two weeks. On the macOS side, a 2026.3 update highlighted faster shader compilation; design teams subsequently measured 20-plus percent shorter export times in professional video applications following verification.
A Linux-focused organization noticed Btrfs allocation improvements in a distribution backport. Server reboot cycles shortened noticeably, allowing the team to reduce maintenance windows and improve overall availability metrics.
Quantifying Gains and Automation Opportunities
Beyond manual checks, scripting baseline collection and post-update comparisons reduces human error. Simple PowerShell or Bash routines can capture and store metrics in a shared repository, enabling trend analysis over multiple update cycles. Teams should also consider integrating these measurements into existing endpoint management platforms for automated alerting when gains fall below expected thresholds.
Common Mistakes to Avoid
- Deploying patches enterprise-wide without first validating performance claims on representative hardware configurations.
- Overlooking driver or firmware interactions that can negate or amplify OS-level improvements.
- Relying on single test runs instead of averaged, repeated measurements under controlled conditions.
- Ignoring the influence of background indexing or update-related services on idle-resource readings.
- Failing to communicate quantified benefits to leadership, which reduces support for future proactive update strategies.
FAQ
How long should teams wait before capturing post-update performance data?
Allow 24 to 48 hours for background processes such as indexing and telemetry uploads to stabilize and provide accurate readings.
Is vendor documentation sufficient without internal testing?
Vendor notes serve as valuable indicators but must be validated against your specific hardware mix and workload patterns to confirm relevance.
Which performance metric delivers the highest user impact for remote employees?
Boot time and application launch latency typically rank highest because they directly affect daily productivity for distributed workers.
How can small IT teams scale this analysis without dedicated lab resources?
Leverage a rotating pilot group of five to ten devices and maintain a simple shared spreadsheet for consistent metric tracking across updates.
Conclusion
Systematic extraction of performance data from 2026 patch notes turns standard maintenance into strategic optimization. Through detailed scanning, controlled benchmarking, expanded checklists, and documented real-world validation, IT teams gain the evidence needed to demonstrate tangible improvements and build stronger cases for timely update adoption.

No comments yet. Be the first!