 NeoBit Daily

Introduction to Advanced Google Sheets in 2026
Google Sheets continues to evolve as a powerful cloud-based spreadsheet tool, offering users sophisticated capabilities for data management and automation. In 2026, professionals and teams rely on it to handle complex calculations, streamline reporting, and integrate with external services. This guide explores practical techniques to move beyond basic functions into custom workflows that save time and reduce errors. Whether you are tracking budgets, generating team reports, or analyzing large datasets, mastering advanced features transforms Google Sheets into a dynamic productivity platform. We will cover complex formulas, conditional formatting rules, Google Apps Script fundamentals, and third-party integrations with step-by-step examples that you can apply immediately.
Advanced users appreciate how Google Sheets supports real-time collaboration while providing scripting tools that rival dedicated programming environments. The platform has grown to include more native functions for data manipulation, making it suitable for enterprise-level tasks without requiring separate software. Throughout this article you will find concrete examples drawn from common business scenarios, along with tips for optimizing performance on large datasets. Recent updates in 2026 have enhanced array handling and improved integration with Google Workspace, allowing even smoother automation across documents and presentations.
Mastering Complex Formulas for Real-World Data
Advanced formulas combine multiple functions to perform dynamic calculations. Start with array formulas and lambda functions, which allow reusable logic without copying cells repeatedly. For example, to calculate weighted averages across a dataset, use: =LAMBDA(data, weights, SUMPRODUCT(data, weights)/SUM(weights)). This approach keeps formulas clean and adaptable. Combine QUERY, FILTER, and SORT for powerful data extraction that updates automatically when source data changes.
Practical tip: Nest IMPORTRANGE with QUERY to pull and filter live data from multiple sheets. Always test formulas on small ranges first to verify results before scaling. Another powerful pattern involves using the new BYROW and BYCOL functions introduced in recent updates. These let you apply custom calculations across entire rows or columns in a single formula. For instance, you can create a running total that automatically expands as new data is added without manual intervention. Users who master these techniques often report significant reductions in manual data entry time.
Consider a sales forecasting scenario where you need to predict quarterly revenue based on historical trends. A combination of FORECAST.LINEAR inside an ARRAYFORMULA can generate projections for hundreds of rows instantly. Always wrap sensitive calculations with error-handling functions such as IFERROR to prevent broken dashboards when source data contains unexpected blanks or text values. Additional useful functions include REGEXEXTRACT for parsing text patterns and EDATE for advanced date manipulations in financial models. Experiment with these in a test sheet to understand their behavior with your specific data types.
Conditional Formatting for Visual Insights
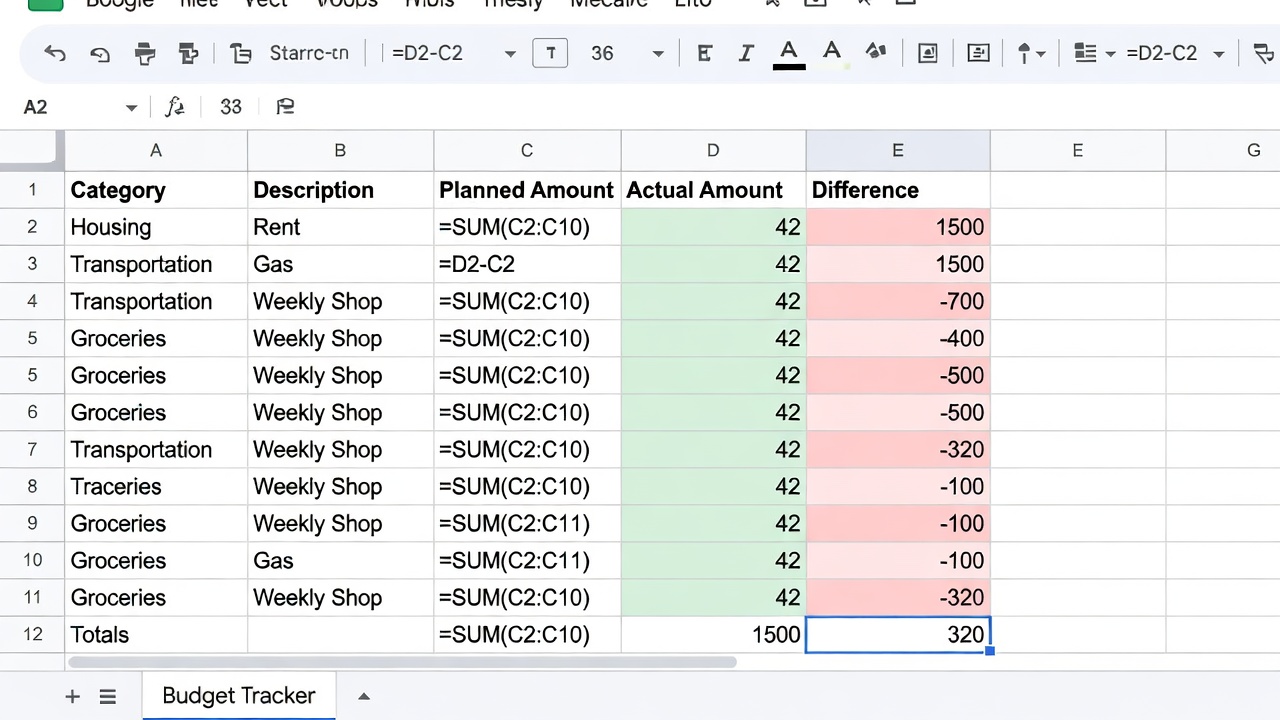
Conditional formatting highlights patterns instantly. Apply color scales to identify trends or use custom formulas to flag outliers. For instance, highlight cells where values exceed the average by 20 percent using =A2>AVERAGE(A:A)*1.2. You can also create icon sets that display arrows indicating whether performance is improving or declining compared to the previous period.
Advanced users create rules based on other cells or even Apps Script triggers. This feature proves invaluable in dashboards where quick visual cues drive decisions. Layer multiple rules carefully, remembering that Google Sheets evaluates them in order. Use the "Stop if true" option to prevent conflicting styles from appearing. For team dashboards, consider color-blind friendly palettes such as blue-orange combinations instead of red-green to ensure accessibility for all viewers. You can also apply formatting based on text length or duplicate values to maintain data quality in collaborative environments.
Getting Started with Google Apps Script
Google Apps Script enables custom automation directly inside Sheets. Access the editor via Extensions > Apps Script. Begin with simple functions like onEdit(e) to trigger actions when cells change. Here is a basic script to send email notifications on row updates:
function sendNotification(e) {
  if (e.range.getColumn() == 5) {
    MailApp.sendEmail('team@example.com', 'Update Alert', 'Row ' + e.range.getRow() + ' was modified.');
  }
}
Deploy scripts as time-driven triggers for scheduled reports. Explore the official Google Apps Script documentation for deeper reference. Always review permissions before granting access to scripts. More advanced patterns include using the Spreadsheet service to create new sheets automatically or the Drive service to organize output files into folders. When working with large data ranges, always prefer batch operations such as getRange().getValues() followed by a single setValues() call rather than looping through individual cells.
Common optimization includes caching values with the CacheService to avoid repeated API calls. This becomes especially important when your script runs on a schedule and processes thousands of rows daily. Debugging is simplified by using the built-in Logger.log() statements and the Execution transcript available in the Apps Script dashboard. You can also extend scripts to generate charts dynamically or export data to Google Slides for presentations.
Third-Party Integrations and Automation
Extend functionality through add-ons and APIs. Connect Google Sheets to tools like Zapier or Make for no-code workflows. For example, automatically export new rows to a CRM or sync data with project management platforms. Common integrations include pulling live stock prices via GOOGLEFINANCE or importing weather data through custom APIs. Review the Google Docs Editors Help center for supported functions and best practices.
Another reliable integration path uses the Google Sheets API directly with Python or JavaScript clients. This approach gives you full control over authentication and data transformation. For users who prefer staying inside the spreadsheet, add-ons such as Supermetrics or Coefficient provide pre-built connectors to marketing platforms and databases. Always test new integrations on a copy of your production sheet to avoid accidental data loss. Secure connections rely on proper OAuth scopes and regular audits of connected services.
Step-by-Step: Budget Tracking Workflow
- Structure your sheet with columns for date, category, amount, and notes.
- Use SUMIFS to aggregate expenses by month: =SUMIFS(amount_range, date_range, ">="&start_date, date_range, "<="&end_date).
- Apply conditional formatting to flag overspending categories.
- Implement an Apps Script to archive completed months automatically.
- Link to a dashboard sheet using IMPORTRANGE for executive summaries.
- Add a dynamic chart that updates when new transactions are entered.
- Include data validation lists for categories to maintain consistency across users.
After implementing these steps, test the workflow with sample data from the past three months. Adjust formulas as needed to handle edge cases such as negative amounts or future-dated entries. This automated budget system can easily scale from personal use to small business financial tracking. Consider adding pivot tables for deeper category analysis and using the built-in Explore feature for AI-assisted insights into spending patterns.
Step-by-Step: Team Reporting Automation
- Create a master data sheet shared with the team.
- Build a QUERY formula that filters data by department or date range.
- Set up a weekly time-driven script to email PDF exports to stakeholders.
- Use data validation dropdowns for consistent input across contributors.
- Monitor script logs to troubleshoot permission or execution issues quickly.
- Generate a summary sheet that calculates key performance indicators automatically.
- Archive historical reports into a dedicated Drive folder each quarter.
These steps create a repeatable reporting pipeline that minimizes manual effort while maintaining data accuracy. Teams that adopt this approach typically see faster turnaround times for monthly and quarterly reviews. Incorporate version history checks before final distribution to ensure the most current data is shared.
Google Sheets vs Excel: 2026 Comparison
| Feature | Google Sheets | Microsoft Excel |
|---|---|---|
| Real-time collaboration | Native and seamless | Requires OneDrive or SharePoint |
| Scripting language | JavaScript-based Apps Script | VBA and Office Scripts |
| Cloud integrations | Extensive Google Workspace ecosystem | Strong Microsoft 365 connections |
| Offline access | Good with browser sync | Robust desktop application |
| Formula complexity | Strong array and lambda support | Advanced dynamic arrays and LAMBDA |
| Version history | Automatic with easy restoration | Available but less granular |
| Add-on marketplace | Growing rapidly in 2026 | Mature with many enterprise options |
Choose Google Sheets when collaboration and cloud automation are priorities. Opt for Excel for heavy desktop computation needs. Many organizations now use both tools together, importing Excel files into Sheets for collaborative editing phases and exporting back for advanced desktop analysis.
Best Practices and Common Pitfalls
Always protect important sheets with appropriate sharing permissions. Use named ranges to make formulas easier to read and maintain. When performance slows on very large files, consider splitting data across multiple sheets or moving historical records to a separate archive. Avoid volatile functions such as TODAY() or RAND() inside array formulas that recalculate frequently. Another key practice is documenting your formulas with comments in adjacent cells or using the NOTE function for clarity during handoffs to other team members.
Frequently Asked Questions
How do I fix formula errors in large sheets?
Use IFERROR or IFNA wrappers around complex formulas. Break calculations into helper columns for easier debugging.
What are common Apps Script optimization tricks?
Batch operations instead of looping cell-by-cell. Use SpreadsheetApp.flush() sparingly and cache frequently accessed values.
Can I integrate Sheets with non-Google services securely?
Yes, leverage OAuth2 and review scopes carefully. Test integrations in a separate sheet before production use.
How should I handle very large datasets?
Split data into multiple sheets or use QUERY to pull only the needed subset. Consider moving historical data to BigQuery for analysis.
What is the best way to version control complex scripts?
Use the built-in version history in Apps Script or integrate with GitHub via the clasp command-line tool for more robust tracking.
Conclusion
Advanced Google Sheets techniques empower users to build reliable, automated systems. By combining sophisticated formulas, conditional formatting, Apps Script, and integrations, you create workflows that scale with your needs. Apply the numbered steps in this guide to your own projects and explore the linked resources for continued learning. Regular practice will turn these tools into second nature for maximum productivity in 2026 and beyond. For additional guidance, consult the official Google Sheets product page.


No comments yet. Be the first!