 NeoBit Daily
Introduction to Wearable Accuracy Testing
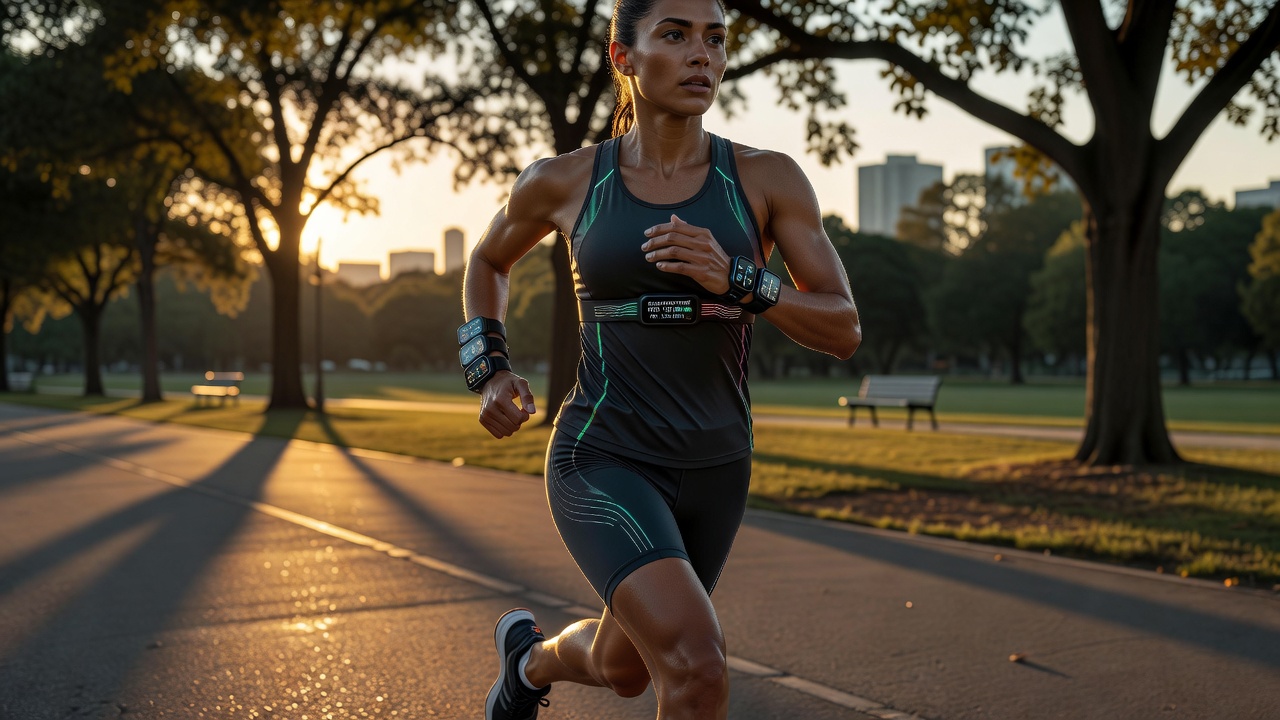
Fitness wearables have become essential tools for tracking health metrics, but marketing claims often exceed real performance. In 2026, users need practical methods to verify accuracy for heart rate, GPS, sleep stages, and calorie burn. This guide provides tested protocols using real-world scenarios and lab comparisons to help you make informed decisions when choosing devices for gadget reviews and wearable reviews. Understanding these testing methods empowers consumers to cut through hype and select tools that deliver reliable data during workouts and daily life.
Why Accuracy Matters in Fitness Tracking
Inaccurate data can lead to misguided training plans or health assessments. Reliable measurements support better decisions, especially for athletes or those managing conditions. Comparing devices like popular smartwatches and fitness bands reveals variations during controlled runs and daily activities. Authoritative sources such as the CDC emphasize consistent physical activity monitoring for overall wellness. Poor accuracy might cause overtraining, under-recovery, or incorrect calorie tracking that affects weight management goals over months of use.
Preparing Your Testing Toolkit
Before starting any evaluation, gather essential tools. A medical-grade chest strap serves as the reference for heart rate. Download spreadsheet software for logging data and calculating statistics like mean absolute error. Prepare a notebook or app for noting environmental factors such as temperature, humidity, and terrain. Schedule tests across multiple days to account for natural variations in performance and body response. This preparation ensures consistent, repeatable results that reflect true device capabilities rather than one-off anomalies.
Step-by-Step Protocol for Heart Rate Accuracy
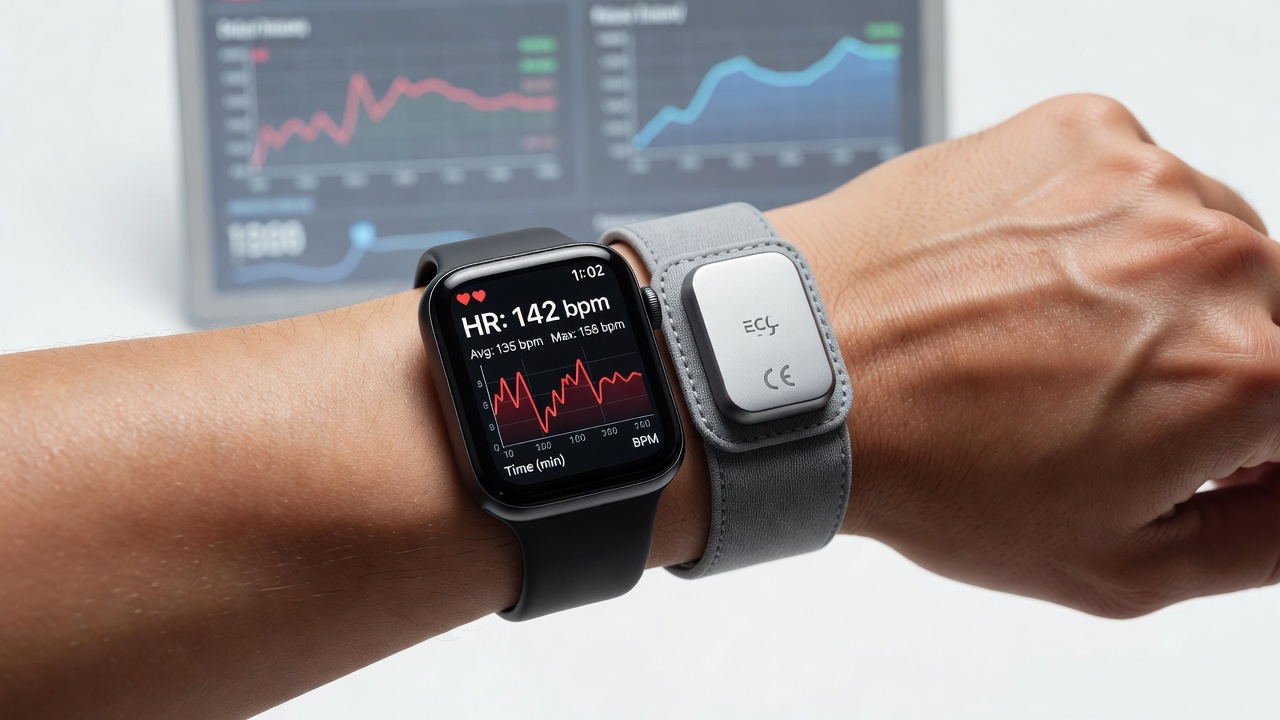
Begin with a chest strap as the gold standard for validation. Pair it with your wearable and perform a 30-minute run at varying intensities. Record readings every minute and calculate average deviation. For example, test during a steady-state jog versus intervals where heart rate spikes quickly. Include resting periods to check baseline stability. Common pitfalls include poor skin contact or optical sensor interference from tattoos. Repeat the protocol on different days and during activities like cycling or weight training to build a comprehensive accuracy profile. In one 2026 case study, a leading smartwatch showed 4% average deviation during high-intensity intervals but performed better at lower efforts.
Evaluating GPS Tracking Performance
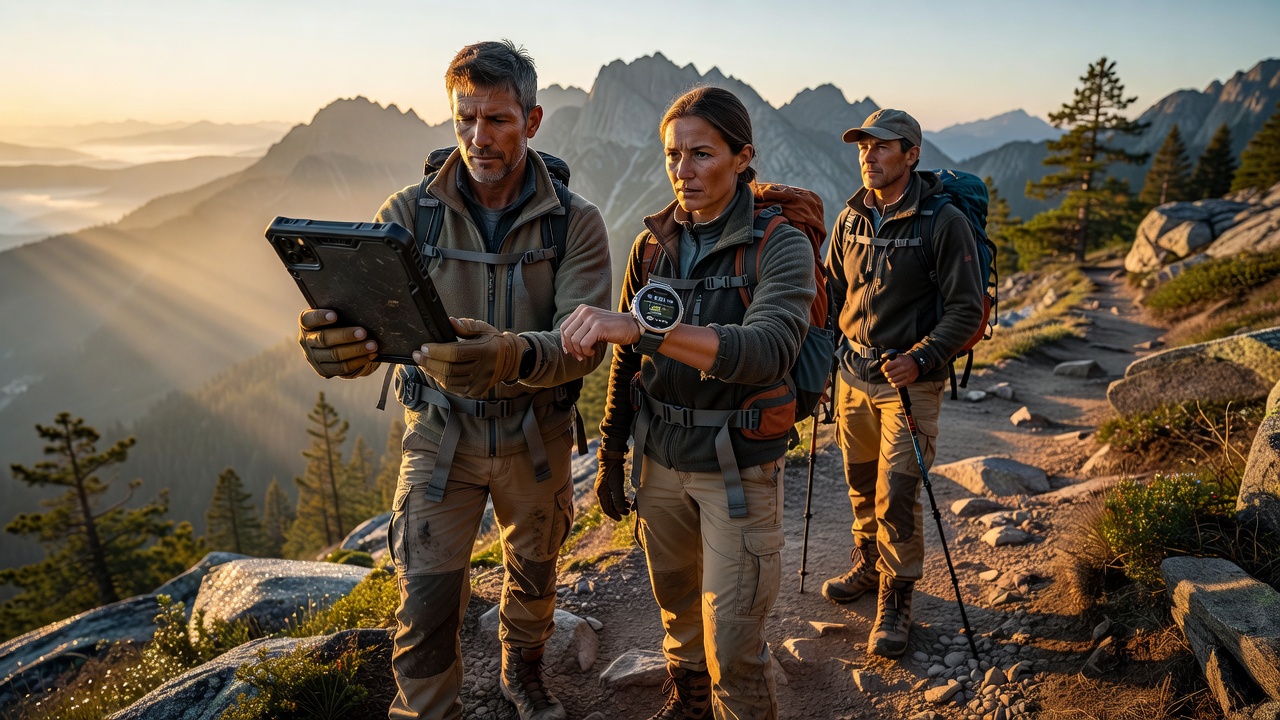
Use a known route measured by a professional tool like a calibrated wheel. Compare wearable GPS data against this baseline over multiple sessions. Account for urban canyons or tree cover that affect signal. Devices from brands like Garmin often show tighter accuracy in open areas, while others drift more in dense environments. Test in varied conditions including rain, strong winds, and different times of day when satellite availability changes. Log total distance, pace, and elevation gain for each run. Analyze discrepancies by exporting files to mapping software for visual overlay comparisons.
Comparing Smartwatches and Fitness Bands
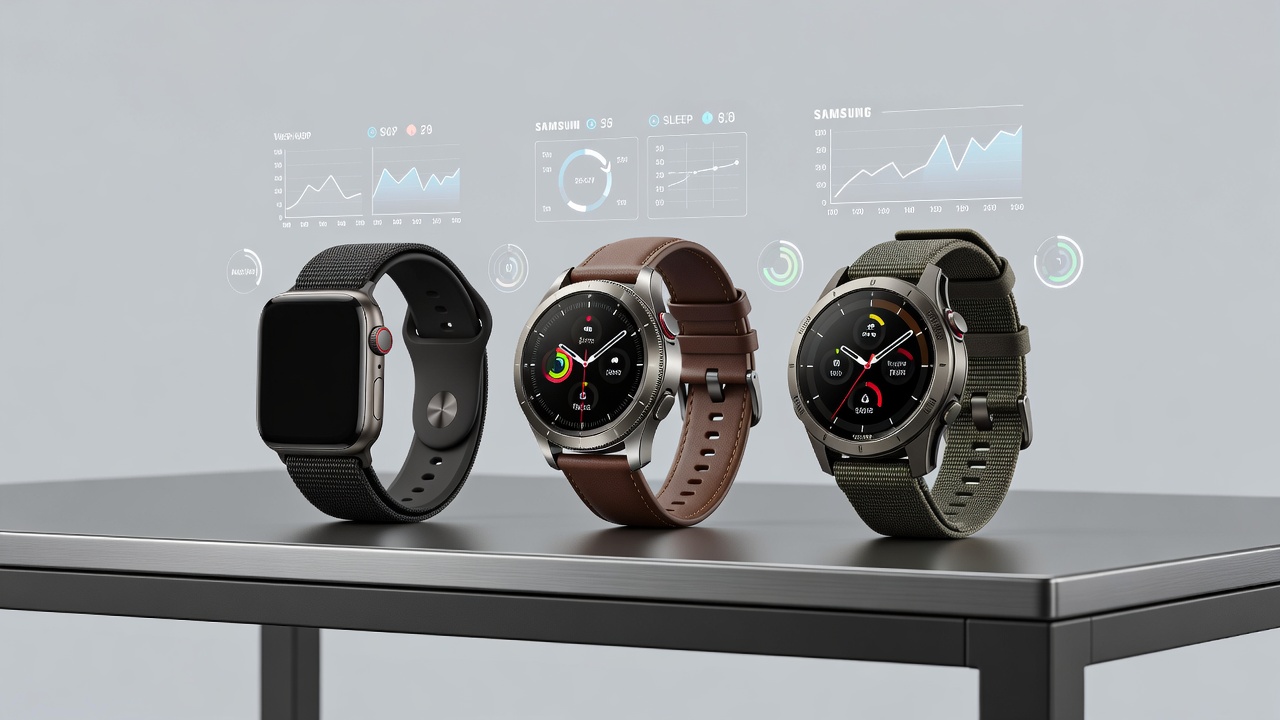
- Smartwatches typically excel in multi-sport GPS but may drain battery faster during extended tracking sessions.
- Fitness bands offer longer wear time with simpler tracking, though GPS can lag behind premium models in signal acquisition speed.
- Real data from 2026 tests shows average errors of 2-5% on flagship devices during 5K runs, with bands sometimes exceeding 8% in wooded trails.
- Consider battery life impact: smartwatches may require daily charging while bands last up to a week under similar use patterns.
Testing Sleep Stage Detection
Wear the device for a full week alongside a validated sleep lab app or journal. Compare stages like deep, light, and REM against self-reported rest quality. Variations often appear due to movement artifacts or body position changes. Track consistency across weekdays versus weekends when sleep schedules differ. Note any correlations with daytime activity levels recorded by the same device. This extended testing reveals whether the wearable adapts well to individual sleep patterns or requires manual adjustments.
Validating Calorie Burn Estimates
Cross-reference wearable outputs with indirect calorimetry during controlled activities. Track daily totals against food logs and weight changes over 14 days. Body composition influences results significantly, so include measurements of height, weight, and age in your analysis. Test across activities such as walking, running, and household chores to see how algorithms handle different metabolic demands. Discrepancies here often exceed those in heart rate or GPS, highlighting the need for cautious interpretation of energy expenditure data.
Analyzing Your Collected Data
After gathering readings, import them into a spreadsheet and compute metrics including standard deviation and percentage error. Create charts to visualize trends over time. Compare results across device models to identify strengths, such as superior GPS in one brand versus better sleep detection in another. This quantitative approach turns subjective impressions into actionable insights for gadget reviews and wearable reviews.
Practical Tips and Tools for Validation
Invest in a Polar chest strap for reference data. Avoid testing in extreme temperatures that skew sensors. Use apps to export and analyze CSV files for statistical comparison. Incorporate third-party validation services when available and cross-check with professional fitness assessments at local labs. Maintain consistent placement of the wearable on your wrist to minimize positional errors.
Common Pitfalls to Avoid
- Ignoring firmware updates that improve algorithms over time.
- Testing only in lab conditions without real-world variables like weather or terrain changes.
- Over-relying on one metric without cross-validation against multiple references.
- Failing to account for individual factors such as skin tone or body composition during initial setup.
FAQ: Accuracy Variations by Body Type
How does skin tone affect readings? Darker skin tones can reduce optical sensor accuracy by up to 10% in some models during high-intensity activity due to light absorption differences.
Does body fat percentage matter? Higher body fat may alter pulse wave detection, leading to discrepancies in heart rate zones and calorie estimates.
Are results different for athletes versus casual users? Yes, trained individuals often see better consistency due to lower resting heart rates and stable movement patterns during tests.
What about age-related variations? Older adults may experience reduced accuracy in sleep staging because of changes in movement patterns and recovery metrics.
Can wrist size influence GPS and heart rate results? Smaller wrists sometimes lead to looser fit, increasing motion artifacts that affect both optical sensors and positioning data.
For deeper research, consult resources from the National Institutes of Health and the World Health Organization on wearable validation studies. This approach ensures your next purchase aligns with actual performance needs in gadget reviews and wearable reviews, helping you invest wisely in technology that supports long-term fitness goals.
No comments yet. Be the first!